Free GA4 Dashboard & Heatmap Plugin for WordPress – DataMetric
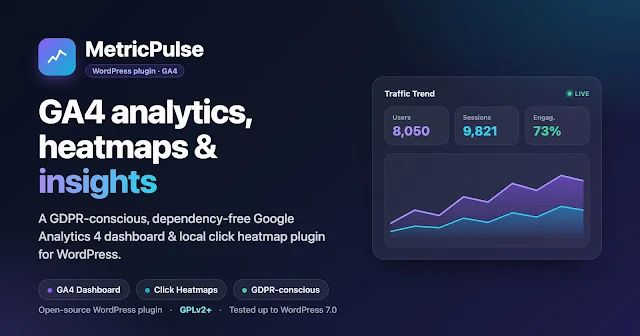
DataMetric Analytics Dashboard and Heatmaps is an open-source, GDPR-conscious analytics plugin that brings Google Analytics 4 (GA4) reports, local click heatmaps, and statistical anomaly insights straight into your WordPress dashboard. Visitors load a dependency-free tracker under 5 KB, while the heavier interface is served only to logged-in administrators.
On this page
DataMetric Analytics Dashboard and Heatmaps is an open-source, GDPR-conscious analytics plugin that brings Google Analytics 4 (GA4) reports, local click heatmaps, and statistical anomaly insights straight into your WordPress dashboard. Visitors load a dependency-free tracker under 5 KB, while the heavier interface is served only to logged-in administrators.
Tags: Requires WordPress 6.0+, Tested up to WordPress 7.0, PHP 8.1+, GPLv2+, Open Source, GA4 Data API
Why I built it
GA4 is powerful, but its interface overwhelms most WordPress owners — and the answers to everyday questions ("which page performs best, where does my traffic come from, where do visitors click?") are always a few screens away. So I built a plugin that gathers the answers I actually need in one panel, without sacrificing performance or privacy: DataMetric.
Key features
📊 GA4 Dashboard
Users, sessions, pageviews, engagement rate and average session duration KPIs, plus a multi-series 7/30-day traffic trend.
🔗 Traffic Acquisition
Source/medium (referrer) breakdown with sessions, users, engagement and key events (conversions) — so you can see which channel brings quality traffic.
🌡️ Local Click Heatmap
See where visitors click, overlaid on your real pages and stored in your own database. Contains no PII and is purged automatically after 30 days. Comes with a sample heatmap in Demo Mode so you can try it instantly.
🟢 Realtime
Track your site's pulse with a live active-visitor count and a "last 30 minutes" sparkline.
🧭 Audience & Geography
Top landing pages, top countries, top events, device distribution, and a new-vs-returning visitor split.
🎯 GA4 Event Builder
Define custom GA4 events without writing code by visually selecting buttons or links on the page.
Installation & usage
📦 Install in three steps
- Upload the plugin ZIP under Plugins → Add New → Upload Plugin and activate it.
- Open DataMetric in the admin menu — it starts in Demo Mode with sample data.
- When ready for live data, add your GA4 Property ID and Service Account JSON under Settings and turn Demo Mode off.
🌡️ See the heatmap
The heatmap renders on your real pages, not inside wp-admin. While logged in as an administrator, open any front-end page, click the floating DataMetric button (bottom-right), switch to the Click Heatmap tab and press Show Heatmap. You get a sample heatmap in Demo Mode, or your real recorded clicks once live.
Under the hood (for developers)
GA4 Data API integration & quota management
Authentication uses an RS256-signed JWT generated from the Service Account JSON. To respect GA4's 5-reports-per-batch limit, reports are split into batches; high-cardinality dimensions are bounded with orderBys + limit, results are cached for 10 minutes, and generation-based cache versioning ensures correct invalidation even behind Redis/Memcached.
Performance-focused front end
Visitors download only an under-5 KB dependency-free (vanilla JS) tracker, loaded in the footer, which batches clicks into a single request. The heavy dashboard (ApexCharts) and interface assets load for authorized users only. Assets are versioned with filemtime for safe cache-busting, and fonts are bundled locally — there are no remote Google Fonts requests, and no other external front-end calls.
Security & data integrity
Service Account credentials are encrypted at rest with AES-256-GCM. REST endpoints are protected by capability checks and nonces; the anonymous click endpoint is protected with a cache-safe same-origin check + rate limiting + bot filter. Scheduled cleanup uses a genuine atomic lock based on add_option(). Cloudflare / reverse-proxy IP ranges are bundled statically for accurate client-IP detection — the plugin never phones home to fetch them.
Visualization & code quality
Charts are rendered with a locally bundled ApexCharts 4.7.0 (no remote CDN). The codebase ships with PSR-4 autoloading, a layered service/repository structure, and a PHPUnit test suite; it supports multisite-aware uninstall and opt-in data deletion. Insights are based on classic mean + standard deviation statistics — not "AI", just honest math.
Technical summary
| Platform | WordPress 6.0+ (tested up to 7.0) / PHP 8.1+ |
| License | GPLv2 or later (open source) |
| Data source | Google Analytics 4 — Data API (Service Account) |
| Front-end tracker | Under 5 KB vanilla JS, no jQuery, consent-aware |
| Heatmap | Local table, no PII, auto-purged after 30 days; sample data in Demo Mode |
| Charts | ApexCharts 4.7.0 (bundled locally) |
| Internationalization | Fully i18n-ready; community translations via translate.wordpress.org |
Who is it for?
- Site owners who want core metrics at a glance without GA4's complexity.
- Agencies and freelancers looking for lightweight, privacy-friendly analytics to embed in client sites.
- Content and SEO teams measuring visitor behavior — heatmaps, landing pages, and channel quality.
Frequently asked questions
Is DataMetric free, and where can I get it?
Yes — it is fully open source under GPLv2+. You can get the source code on GitHub; submission to the WordPress.org plugin directory is in progress.
Do I need a Google Analytics account to try it?
No. On activation the plugin runs in Demo Mode, which previews every report and the click heatmap with realistic sample data — no connection required. To display your own live data you need a GA4 property and a Service Account.
Will it slow down my site?
The goal is the opposite. Visitors download only an under-5 KB dependency-free script; heavy dashboard assets load solely for logged-in administrators, and no external requests (such as Google Fonts) are made.
Is it GDPR-compliant?
Click data contains no personal information and is stored on your own server. The tracker starts in opt-in mode by default and integrates with popular cookie-consent plugins.
DataMetric Analytics Dashboard and Heatmaps is an independent open-source project developed by Rıdvan Bilgin. Google Analytics and GA4 are trademarks of Google LLC; this project is not endorsed by or affiliated with Google.
No comments yet. Be the first.